- Source, Silver Fortune
Saturday, November 30, 2019
China is Threatening to Pop the Global Debt Bubble
Wednesday, November 27, 2019
Financial Crisis Might Be Best Thing to Happen to the Economy
This was a stunning revelation and the biggest auditing discovery in the history of accounting. This is being ignored by academia, government and the MSM, but you cannot pretend there will be no consequences forever. Dr. Skidmore says, “The financial crisis that may come in the near future may not be the worst thing.
That may be the best thing so we can reset and get a footing in reality and something that has integrity. I am concerned we won’t turn back and move in the right direction.
What does it mean to my children when a government can say we can just create fake books and pretend they are real? This sure looks like a giant fraud to me.
These unsupported adjustments are a sign of fraud. Why don’t we look?”
- Source, USA Watchdog
Monday, November 25, 2019
Peter Schiff: QE4 Sends Dow Above 28,000
Now, I'm sure everybody is getting their "Dow 30,000!" hats ready, because obviously that's not too far off, now from 28,000. But it's not just the Dow that is setting records and crossing milestones.
The NASDAQ - another record high today - up 61.81, closing at 8,540.83. That's the first time the NASDAQ has been above 8,500. The S&P also making new highs, up 23.83 - 3120.46 is the close . This is the first time the S&P has been above 3100.
- Source, Peter Schiff
Sunday, November 24, 2019
Jeff Snider: The Financial System Is Broken
Snider explains why this problem is not coming up out of the blue and breaks down why he views recent market moves as a sign that the banks are telegraphing their knowledge of major threats to the monetary system.
- Source, Real Vision Finance
Friday, November 22, 2019
Thursday, November 21, 2019
How the Fed Boosts the One Percent, as Told by the Fed
Even the upper middle class loses share of household wealth to the 1%. The bottom half gets screwed.
- Source, The Wolf Street Report
Wednesday, November 20, 2019
Craig Hemke: ECB Global Recession Crisis
- Source, Reluctant Preppers
Tuesday, November 19, 2019
Ignoring It Won't Make It Go Away: The Fed's Bubble Will Burst
The President has the same erroneous view. But ignoring the biggest bubble that the Fed has ever created will not make it go away.
- Source, Ron Paul
Monday, November 18, 2019
Thursday, November 14, 2019
Golden Opportunity: It Amazes Me How Bearish Gold Investors Have Become

Several months ago, back in early June, I notified those willing to listen that gold was preparing to “take off like a rocket-ship.” To my members of ElliottWaveTrader.net, I outlined my expectations for a strong rally to the 137 region, followed by a continued move to the 143/45 region before we see a larger consolidation. Thus far, the market has been reacting as generally expected.
In my last public metals article, I noted that the market was not providing us any signs that a bottom has been struck just yet. Rather, the rally we experienced in October was quite overlapping and did not satisfy my need to see a 5-wave rally to confirm that a bottom has already been struck.
So, in the last week of October, GLD provided us with a small degree 5-wave decline. That provided us advance warning that the next bout of weakness in the metals complex was
At this point in time, we are approaching my ideal target region.
But, what really amazes me is how bearish many have now become of the metals. I am reading many posts, blogs and articles which are starting to view this as a “fake rally.” Yet, I don’t think the structure of the metals market is supportive of that perspective.
The rally we have experienced over the last year has been quite
Therefore, as long as GLD remains over the 130/131 support region (and ideally over 133), my next target region is the 157-161 region.
But, before I am willing to trade that next rally aggressively, I am going to wait for the market to provide us with a clear 5-wave structure
In the meantime, I am looking for a local bottom to be struck in our gold price forecast over the coming week or two, and followed by a 5-wave rally off that low. That will then put us on warning to prepare for the next major rally phase over the coming months.
Lastly, the next time we see a 5-wave structure
For those that would like to understand this methodology a bit better, please feel free to read through the six-part series I penned on ElliottWaveTrader, which explains my methodology from the theoretical and technical perspectives.
- Source, Goldseek
Wednesday, November 13, 2019
Alasdair Macleod: Acute Failure of the Monetary System
Alasdair also gives us a report on the UK situation on the ground with the Brexit from the EU, and what it means for the Euro and the USD.
He further answers YOUR viewer questions about BOND REPOS, "Not QE," the phenomenon of multiple countries trying to repatriate their gold from the global exchanges, and the trade-offs between owning gold mining stocks vs. physical metal.
- Source, Reluctant Preppers
Worst In Five Years: October Budget Deficit Surges 34% To $134 Billion
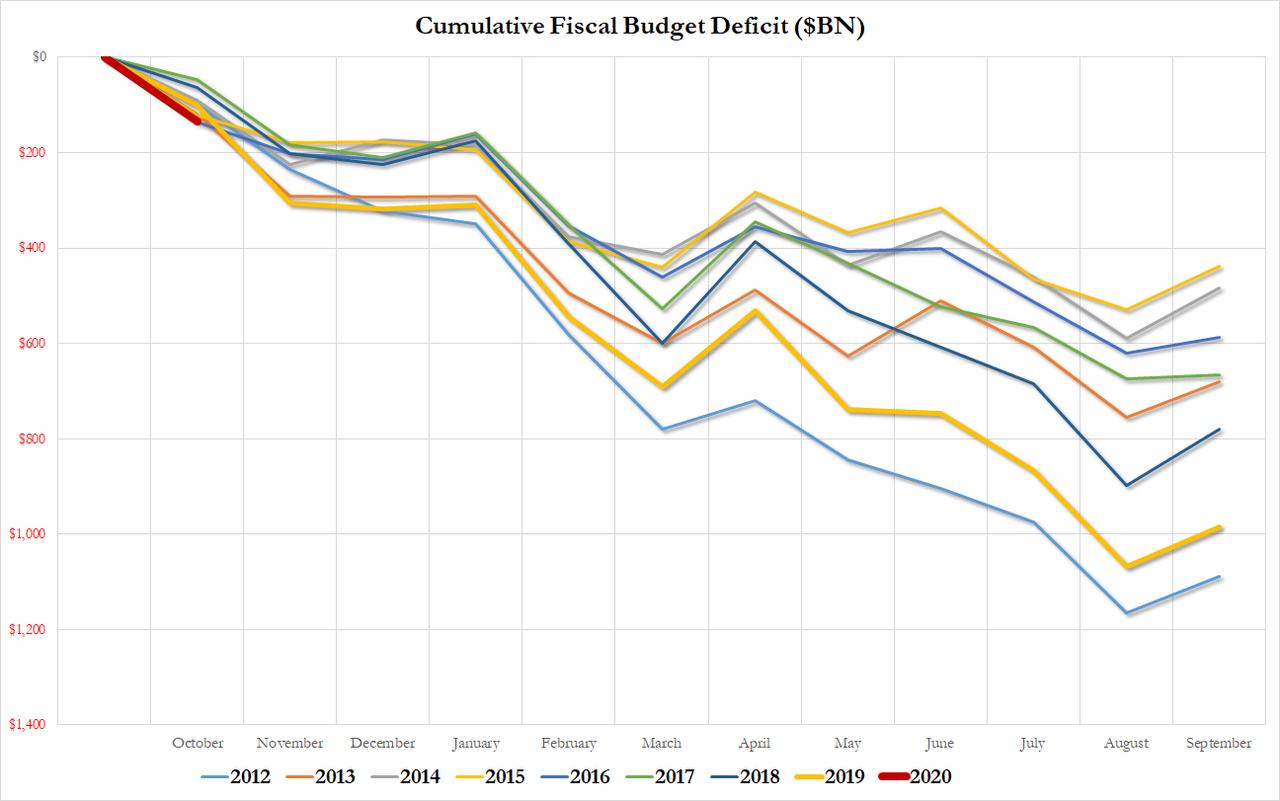
One month after the Treasury reported that in fiscal 2019 the US budget deficit hit $984 billion, a 26% increase from a year earlier, and the largest annual deficit since 2012's $1.1 trillion, today the US Treasury released the latest monthly deficit data which revealed that in October, the first month of Fiscal 2020, the US deficit shortfall hit $134 billion, a $34 billion, or 34%, increase to the $100 billion deficit in October 2018, bigger than the average forecast of $130 billion.

October's deficit was the biggest in five years, just shy of the $136.5 billion in October 2015, and sets the US on the path to surpassing a $1 trillion deficit for the first time in eight years.
In the first month of fiscal 2020, income of $246billion dropped 2.8% from a year earlier, while spending of $380 billion jumped 7.6%. The biggest sources of income were individual income taxes ($126 billion), social insurance and retirement ($90 billion), while the biggest outlays were social security ($89 billion), national defense ($71 billion), medicare ($56 billion) and health ($51) billion, while the US Treasury spent $33 billion on interest on the Federal debt, roughly the same that it spent on veterans' benefits, education, and agriculture combined.
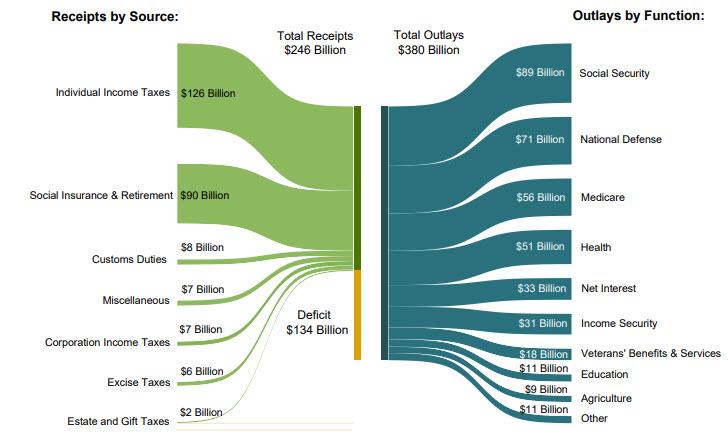
The monthly deficit would have been greater had Trump not imposed tariffs on Chinese goods: in October, customs duties boosted US revenue by $7.8 billion, up from $5.6 billion a year ago, and represents tariffs U.S.companies paid on imports of Chinese merchandise.
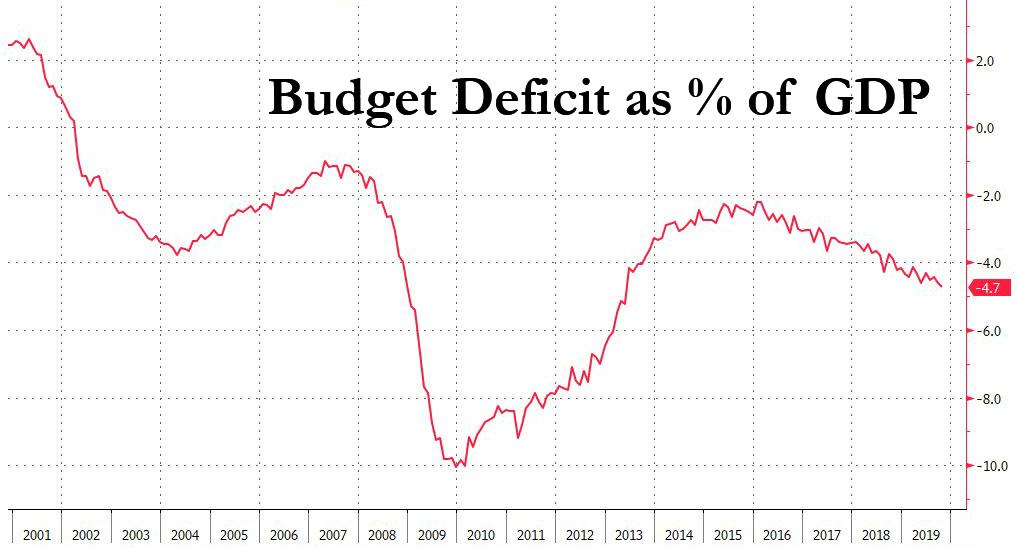
In October, the cumulative 12-month deficit gap hit 4.7% of GDP, the largest since May 2013. The US has not had a full-year budget surplus since 2001.

So far this year, the CBO's forecast is spot on: the budget office estimated the October deficit would be $133 billion, and it sees the total federal deficit topping $1 trillion in the current and 2021 fiscal years, about 5 % of GDP.
Addressing Congress earlier on Wednesday, Fed Chairman Jerome Powell said that "the federal budget is on an unsustainable path" that ultimately could limit lawmakers’ ability to support the economy in a downturn. During the question-and-answer period before the Joint Economic Committee, Powell said lawmakers can’t ignore deficits and that it’s important for the economy to grow faster than debt. Alas, one look at the CBO's long term debt forecast suggests that by that definition, the US is probably doomed...
October's deficit was the biggest in five years, just shy of the $136.5 billion in October 2015, and sets the US on the path to surpassing a $1 trillion deficit for the first time in eight years.
In the first month of fiscal 2020, income of $246

The monthly deficit would have been greater had Trump not imposed tariffs on Chinese goods: in October, customs duties boosted US revenue by $7.8 billion, up from $5.6 billion a year ago, and represents tariffs U.S.
In October, the cumulative 12-month deficit gap hit 4.7% of GDP, the largest since May 2013. The US has not had a full-year budget surplus since 2001.
So far this year, the CBO's forecast is spot on: the budget office estimated the October deficit would be $133 billion, and it sees the total federal deficit topping $1 trillion in the current and 2021 fiscal years, about 5 % of GDP.
Addressing Congress earlier on Wednesday, Fed Chairman Jerome Powell said that "the federal budget is on an unsustainable path" that ultimately could limit lawmakers’ ability to support the economy in a downturn. During the question-and-answer period before the Joint Economic Committee, Powell said lawmakers can’t ignore deficits and that it’s important for the economy to grow faster than debt. Alas, one look at the CBO's long term debt forecast suggests that by that definition, the US is probably doomed...
- Source, Zero Hedge
Many Indications Gold and Silver Prices Have Likely Bottomed
Tuesday, November 12, 2019
Has The Fiat Currency Crisis and Crack Up Boom Begun?
But what does this mean for the US dollar, fiat currencies, gold, silver, and the hyper-inflationary monetary death spiral that we're all about to not just bear witness to but also participate in?
- Source, Silver Doctors
Doug Casey: You Can Run But You Can't Hide
Doug Casey,
- Source, Reluctant Preppers
Monday, November 11, 2019
Behold the Gift of Gold...
"Where do you see Gold finishing the year?" Directed at yours truly came that question from across the square table at last Sunday's Investors Roundtable, the price of Gold then at 1517. The instinctive response with nary a thought (which is said to be the hallmark of a good trader and by our experience works some 50% of the time) was "Probably right about in here."
Not to have taken the wind out of the sails (let alone wiped drool off the lips) from those wanting to have instead heard the bandied-about figure of "1600", but 'tis what 'tis . We then lightly elaborated upon that which you valued readers have already come to know these many weeks: that subsequent to Gold having achieved our "aggressive" forecast high for this year of 1526 back on 12 August, (from which there were two swiftly -failed follow-throughs to the mid-1500s), price has been fairly range-bound, indeed congested throughout, within the high-1400s to low-1500s. You can see that by price's track in the above Gold Scoreboard ... until this week's lurch lower.
'Course with seven full trading weeks still remaining in 2019, the return toward our so-called "centerpiece price" of 1526 not only is viable but we think likely. In fact, this lurch lower -- which found Gold settling out the week yesterday (Friday) at 1460 -- one might regard as anticipated, healthy, and finally as having happened.
You know where we're going withthis but 'tis worth the repeat. And to put it in visual context , let's go straightaway with Gold's weekly bars from one year ago-to-date:

The now eight-week run of parabolic Short trend per the rightmost red dots kicked into lower gear back on 20 September. Since such date, you've herein regularly readof the 1454-1434 pricing area referred to as a support shelf -- its lavender rectangle added to the above graphic -- which Gold could well test during this parabolic Short trend. Recall, too, that 1434 had initially been our "conservative" forecast high for this year (achieved pre-dawn on 25 June whilst we were wifi'ing in Terminal 2 at Aeroport Nice Côte d'Azur ) from which price then floundered about for better than a month toward creating a resistance area before breaking out higher to 1526 . And you know the old tried-and-true traders' saying: resistance becomes support which is how we now view the 1454-1434 zone, Gold this past week coming within a whisker of testing it by trading down yesterday to as low as 1457.
Will the 1454-1434 support shelf stick? We ought think so. As of a week ago, Gold had been putting in its best year (+18%) since 2010 (+29%), but with this lurch lower is now tied with 2017's full-year performance 'round +14%. Still, there's no fundamental nor technical rationale to throw the baby out with the bathwater: markets ebb as well as flow. And per last week's missive, we're now working through Gold's "No-Go" from which we 'spect we'll move toward year's-end with "Go-Go" back up into the 1500s. But should 1434 materially fail, please have Santa present us with a dunce cap for Christmas. And better as a gift to yourself, this support shelf -- as we always caution given prudent cash management -- appears as a nice price area to buy Gold.
One might even dub Gold's having pulled in its reigns of late as "the pause that refreshes". For in next lookingto our graphic of Gold's daily closes since the highest ever at 1900 back in 2011, price upon embarking from our old nemesis "The Box" (1240-1280) this past June pretty much has gone straight up the lift shaft to now dawdle about, (just below the 1541 blue line from which the weekly parabolic trend would flip from Short to Long were that price remotely to be reached in the new week). But in looking at Gold per this broader context, 'tis been one heckova great run of late. Moreover, as that horizontal blue line mathematically moves lower week-by-week, such parabolic flip back to Long is certainly in play before the year is out, (barring the baby with the bathwater being thrown out):

'Course, 'tis all about riding the complacency wave of stocks. After all, they only go up, the S&P 500 hitting all-time highs in six of the past ten trading days. Even though the Federal Open Market Committee members are shying away from further rate allay. Even though with most constituents having reported their Q3 earnings, only 62% have beaten the like quarter of a year ago. Even though the mighty Index's "live" price/earnings ratio as honestly calculated is 33.5x. Even though the Economic Barometer -- which did have a better week -- nonetheless broadly has been working lower. Here's the Baro (blue line) year-over-year with the S&P (red line) wandering -- no, "rocketing" -- into deep space:

Yes, there were a few shining bulbs from the week just past: The Institute for Supply Management's October Services reading ticked higher for just the fourth month of this year's ten; and the Trade Deficit was reduced in September aswere Wholesale Inventories; all good, that. BUT: Mr. Stagflation reared his ugly head in Q3 as Unit Labor Costs rose +3.6% -- the most since Q2 for 2016 -- and Productivity fell -0.3%, the largest drop since that same Q2 back in 2016. And following those like 2016 reports, the S&P then slumped -5% that year from August through October. Just sayin'...
Not to have taken the wind out of the sails (let alone wiped drool off the lips) from those wanting to have instead heard the bandied-about figure of "1600", but '
'Course with seven full trading weeks still remaining in 2019, the return toward our so-called "centerpiece price" of 1526 not only is viable but we think likely. In fact, this lurch lower -- which found Gold settling out the week yesterday (Friday) at 1460 -- one might regard as anticipated, healthy, and finally as having happened.
You know where we're going with
The now eight-week run of parabolic Short trend per the rightmost red dots kicked into lower gear back on 20 September. Since such date, you've herein regularly read
Will the 1454-1434 support shelf stick? We ought think so. As of a week ago, Gold had been putting in its best year (+18%) since 2010 (+29%), but with this lurch lower is now tied with 2017's full-year performance 'round +14%. Still, there's no fundamental nor technical rationale to throw the baby out with the bathwater: markets ebb as well as flow. And per last week's missive, we're now working through Gold's "No-Go" from which we '
One might even dub Gold's having pulled in its reigns of late as "the pause that refreshes". For in next looking
'Course, '
Yes, there were a few shining bulbs from the week just past: The Institute for Supply Management's October Services reading ticked higher for just the fourth month of this year's ten; and the Trade Deficit was reduced in September as
- Source, deMeadville, read the full article here
How Much Lower Will Silver and Gold Go?
Sunday, November 10, 2019
The Real Drivers Behind Higher Gold Prices Are Yet to Come
“There are a lot of catalysts that have pushed gold to where they are now. We broke through that $1,400 ceiling and now the $1,400 seems to be the floor,” Clark told
“It’s not surprising that gold came a little weaker recently, but when you think about it, the big catalysts that are out there, that will drive gold and silver higher, haven’t even begun to play out yet.”
- Source, Kitco News
Saturday, November 9, 2019
Nick Barisheff: What Will Drive Gold to $10000?
- Source, Reluctant Preppers
Friday, November 8, 2019
The Wolf Report: What’s Behind the Fed’s Bailout of the Repo Market?
- Source, The Wolf Report
Thursday, November 7, 2019
Newfound Economic and Market Optimism A Warning?
On top of that, we have the latest spectacular jobs report that simply blew everybody's minds! But is the economy really as good as the propagandists are spinning it to be, and what is the risk in embracing this newfound optimism?
- Source, Silver Doctors
Wednesday, November 6, 2019
The path to $3,000 gold and beyond depends on this...
“What I look at is the balance sheet of Federal Reserve ,” Oliver told Kitco News. “When [government] bonds finally break down, and they will break down someday because congress is insolvent, the only thing else on the Fed’s balance sheet is of course the gold, because they said they have 8,100 tonnes of gold.”
- Source, Kitco News
Would China and Russia Use the Nuclear Option on the United States?
Such a move would cause a severe spike in US interest rates, crash our stock market, and easily push the economy into recession. It’s an extreme scenario, and many analysts believe it would temporarily hurt their own economies, too.
But neither is the risk zero , given the unending tension in the trade and currency wars. As Mike Maloney and Ronnie Stoeferle discuss in their third video, while US Treasury holdings of both countries are in decline, they are both simultaneously loading up on gold. Russia has been a long-standing buyer on a monthly basis, and China has now added gold to its Reserves for 10 consecutive months.
As Ronnie says, “it’s no coincidence that China is updating its gold reserves monthly.” The gold-buying trend stretches beyond China, Russia and other emerging markets. Many countries in Europe have been aggressively adding gold to their Reserves—for example, Poland, Romania, and Hungary.
Further, many of these countries are repatriating their gold from London. In other words, the gold buying isn’t coming just from countries that are hostile to the US, but also its allies.
- Source, Gold Silver
Tuesday, November 5, 2019
The Not Enough Inflation Hoax: Is It Ignorance or Deception?
The dollars that you work hard for are always buying less and less, yet the government tells you there's 'not enough inflation'.
The Federal Reserve is a government-created monopoly that counterfeit dollars by the billions and trillions, and you're supposed to believe that this is "capitalism." Oh, the tangled web they weave...
- Source, Ron Paul
Saturday, November 2, 2019
Nick Barisheff: Gold Beating Buffett Since 2000, Will Continue to Do So
Every week, there are new warnings sounding about an ever increasing wobbly economy? Stocks are near record highs, and so is the global debt.
So, what do you do?
Nick Barisheff, CEO of Bullion Management Group (BMG), says, “In the U.S. dollar since 2000, gold is up an average of 9.4% per year. In some countries, it’s up 14% and so on.
If you take the overall average of all the countries, the average increase is 10% a year. Every time Warren Buffett is on CNBC, he seems to go out of his way to disparage gold, but if you look at a chart of Berkshire Hathaway and gold, gold has outperformed Berkshire Hathaway.
Everybody worships Warren Buffett as the best investor in the world, and gold has outperformed his fund in U.S. dollars . I would not disparage gold if I were him. I’d keep quiet about it.”
There is a first for Barisheff, too, in this financial environment. He says for the first time ever, he’s “100% invested in gold” as a percentage of his portfolio. He says the bottom “is in for gold,” and “the bottom is in for silver, too.”
Barisheff contends with the record bubbles and the record debt, both gold and silver will be setting new all-time high records, as well, in the not-so-distant future.
- Source, USA Watchdog
Friday, November 1, 2019
What if the Fed Stops Cutting Rates?
Fed rate cuts have been the driving force of the recent gains in precious metals.
This is not a surprise to our readers as since 2018 we argued that a shift in Fed policy from rate hikes to rate cuts would springboard the next big move. History argued the same.
The market is showing a roughly 90% chance the Fed will cut rates this week which indicates the market has essentially already priced in the rate cut.
The potential for a pause in the rate cuts could be why Gold, Silver and mining shares are all off their summer highs, despite an imminent rate cut.
This is why we expect the precious metals sector will continue to correct and especially in terms of time. It remains to be seen whether the correction continues as aprice correction or morphs into a bullish consolidation.
In either case, precious metals will need a new narrative if the Fed pause is sustained well into 2020. Enter rising inflation and rising inflation expectations.
With respect to the Fed, if they don’t raise rates as inflationrises then that causes a steepening yield curve as well as a decline in real interest rates. Those things are bullish for precious metals.
In the chartbelow we plot the inflation expectations ETF RINF followed by the TIP to TLT ratio, the CRB (commodity prices) and the Yield Curve.
Note how inflation expectations increased in 2016 and until the middle or end of 2018. It was also during this time that the yield curve flattened as the Fed raised rates.
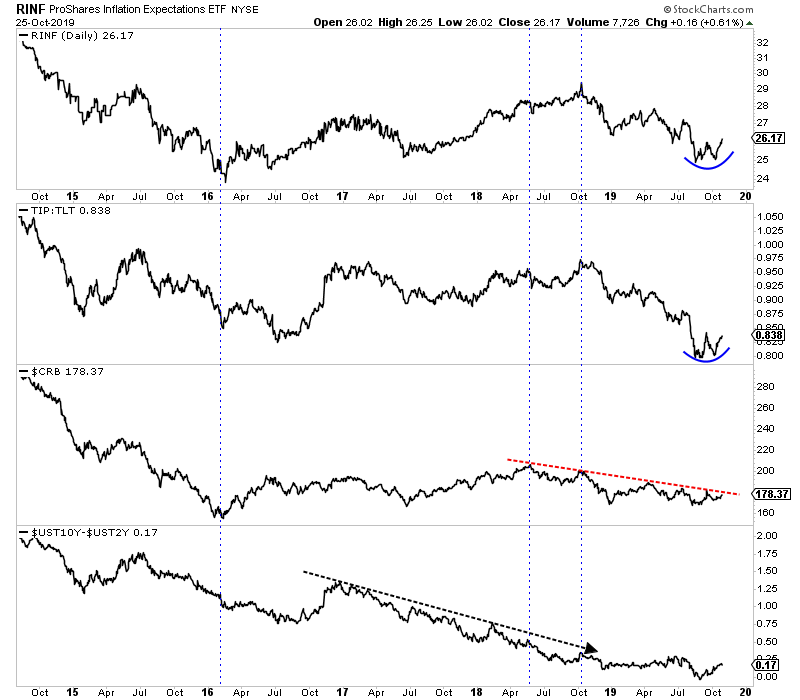
The combination of rising inflation and rising inflation expectations was not bullish for precious metals in 2017 and 2018 because the Fed raised rates, the yield curve flattened and real interest rates declined.
At present we can see RINF and TIP vs. TLThave formed double bottoms while the CRB is on the cusp of breaking its downtrend and the Yield Curve has rebounded.
Simply put, if inflation and inflation expectations trend higher like in 2017 and 2018 but the Fed doesn’t raise rates, it is bullish for precious metals. In this scenario, Silver will outperform Gold and the juniors would outperform also.
Over the past week or so there have been a few positives with respect to the mining stocks. Both GDX and GDXJ formed mini-double bottoms while the silver stocks have performed even better.
We do need to keep an eye out for how the miners perform if the Fed indicates a pause is coming. Their performance over the weeks ahead could give us an early hint as to how much longer the correction will last.
In the meantime, we have been focusing on identifying and accumulating quality juniors with significant upside potential in 2020.
This is not a surprise to our readers as since 2018 we argued that a shift in Fed policy from rate hikes to rate cuts would springboard the next big move. History argued the same.
The market is showing a roughly 90% chance the Fed will cut rates this week which indicates the market has essentially already priced in the rate cut.
The potential for a pause in the rate cuts could be why Gold, Silver and mining shares are all off their summer highs, despite an imminent rate cut.
This is why we expect the precious metals sector will continue to correct and especially in terms of time. It remains to be seen whether the correction continues as a
In either case, precious metals will need a new narrative if the Fed pause is sustained well into 2020. Enter rising inflation and rising inflation expectations.
With respect to the Fed, if they don’t raise rates as inflation
In the chart
Note how inflation expectations increased in 2016 and until the middle or end of 2018. It was also during this time that the yield curve flattened as the Fed raised rates.
Inflation Expectations Indicators
The combination of rising inflation and rising inflation expectations was not bullish for precious metals in 2017 and 2018 because the Fed raised rates, the yield curve flattened and real interest rates declined.
At present we can see RINF and TIP vs. TLT
Simply put, if inflation and inflation expectations trend higher like in 2017 and 2018 but the Fed doesn’t raise rates, it is bullish for precious metals. In this scenario, Silver will outperform Gold and the juniors would outperform also.
Over the past week or so there have been a few positives with respect to the mining stocks. Both GDX and GDXJ formed mini-double bottoms while the silver stocks have performed even better.
We do need to keep an eye out for how the miners perform if the Fed indicates a pause is coming. Their performance over the weeks ahead could give us an early hint as to how much longer the correction will last.
In the meantime, we have been focusing on identifying and accumulating quality juniors with significant upside potential in 2020.
- Source, The Daily Gold
Subscribe to:
Posts (Atom)