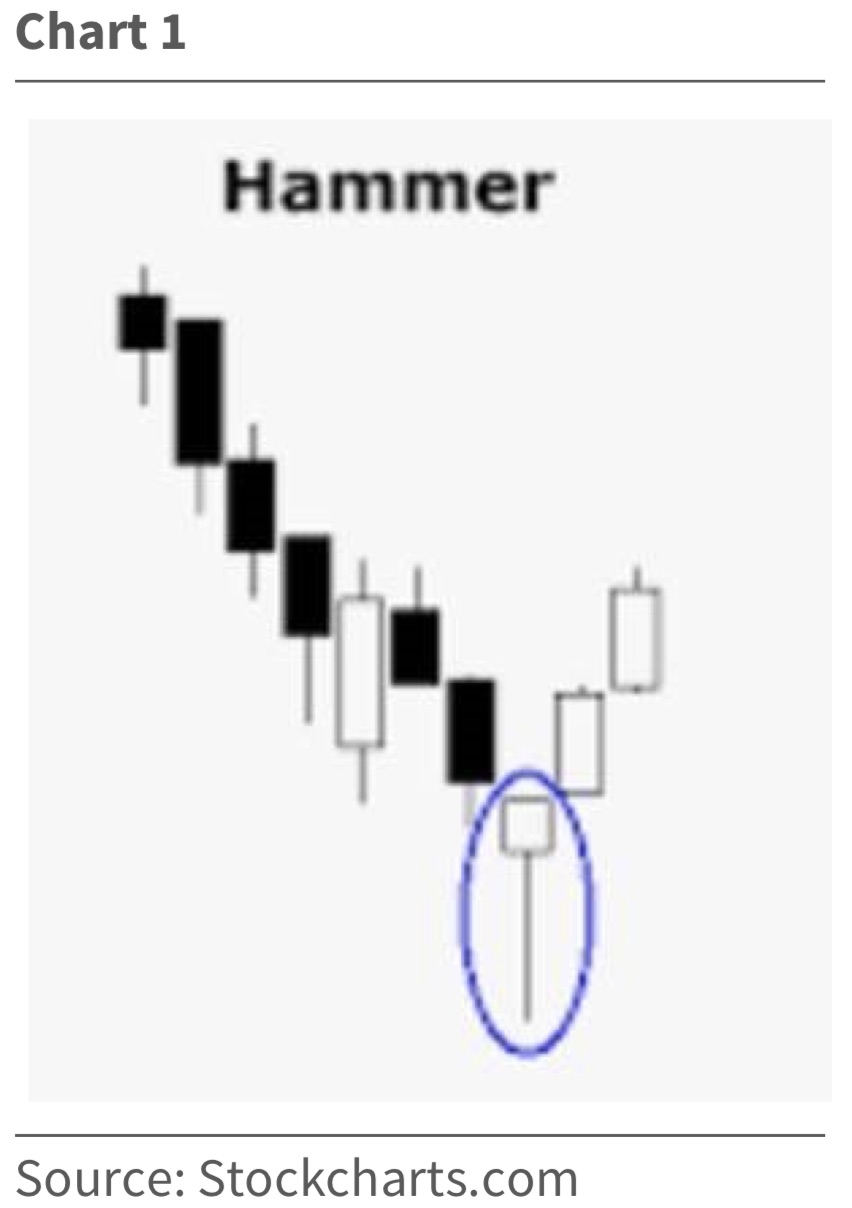
“A hammer is a type of bullish reversal candlestick pattern, made up of just one candle, found in price charts of financial assets. The candle looks like a hammer, as it has a long lower wick and a short body at the top of the candlestick with little or no upper wick (see chart below).”
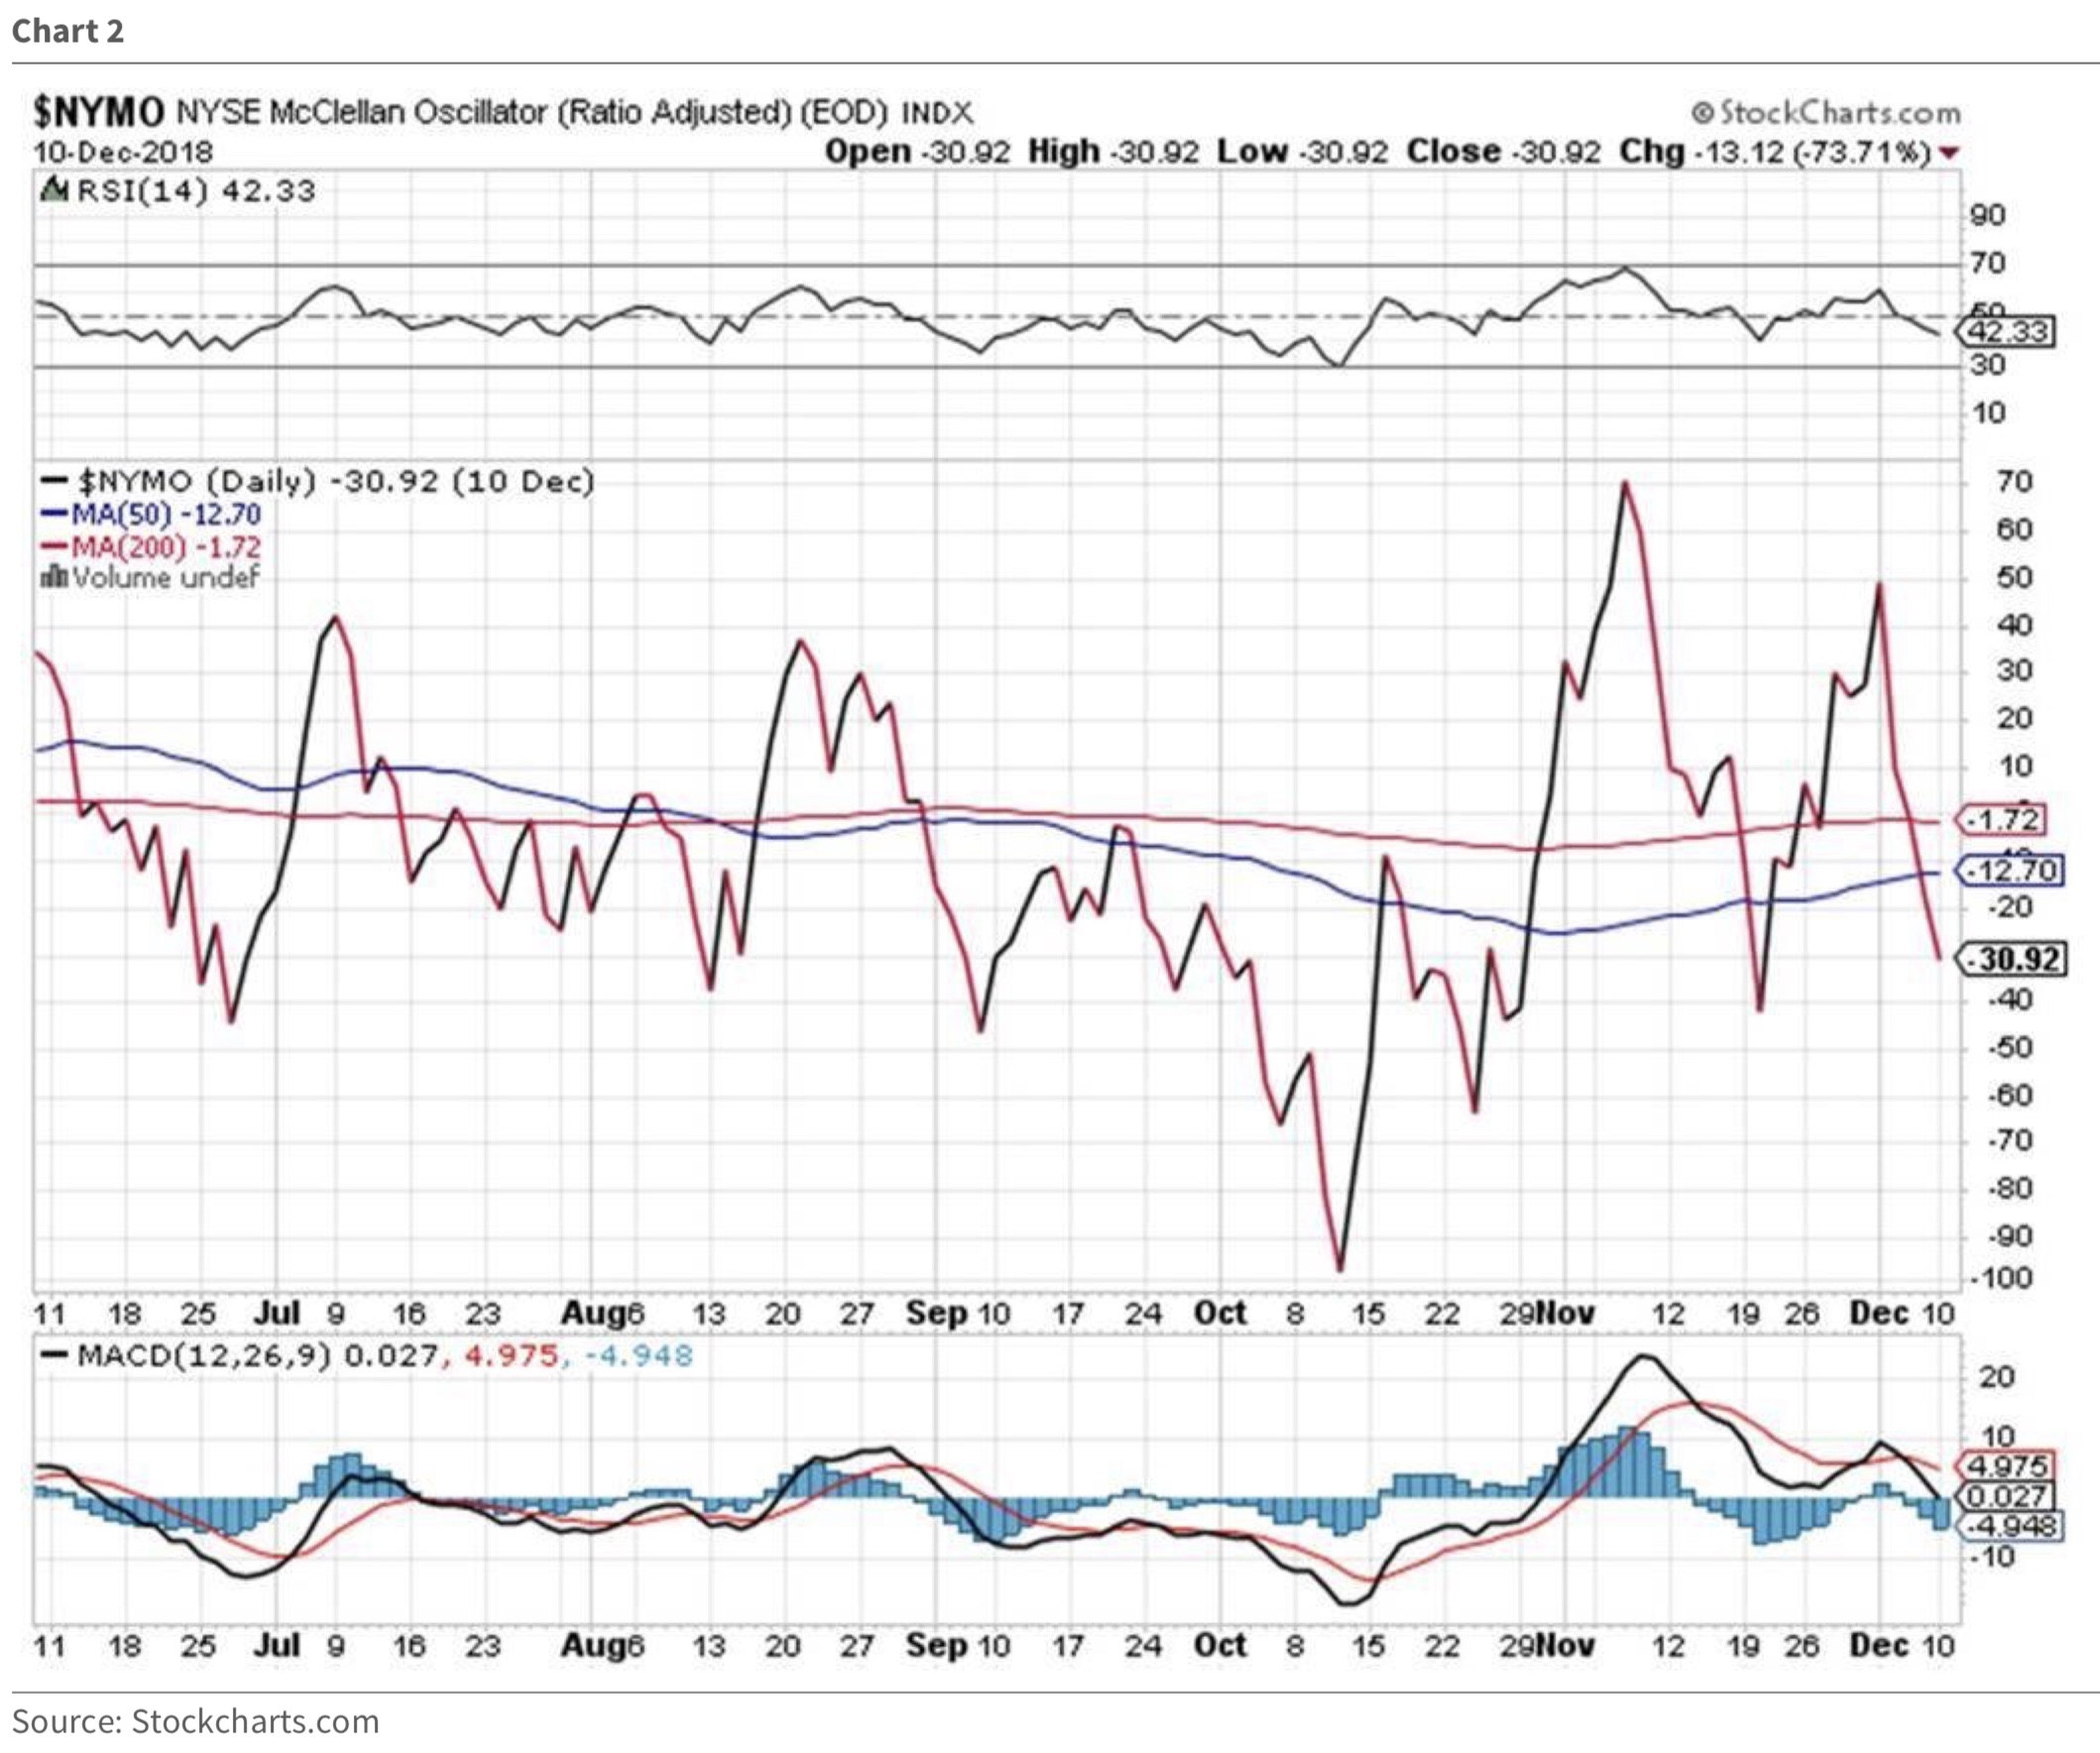
Ralph Block & The McClellan Oscillator
Also suggestive that a bottom was made on Monday was what our deceased friend Ralph Block used to term a multi-swinging session. To wit, “Ralph was a huge fan of a crater opening, multi-swinging session that ends near the high of the day. Looks like it was just what he would have wanted!” We would add that the McClellan Oscillator is pretty oversold on a short-term basis (see chart below).
McClellan Oscillator Is Very Oversold Short-Term
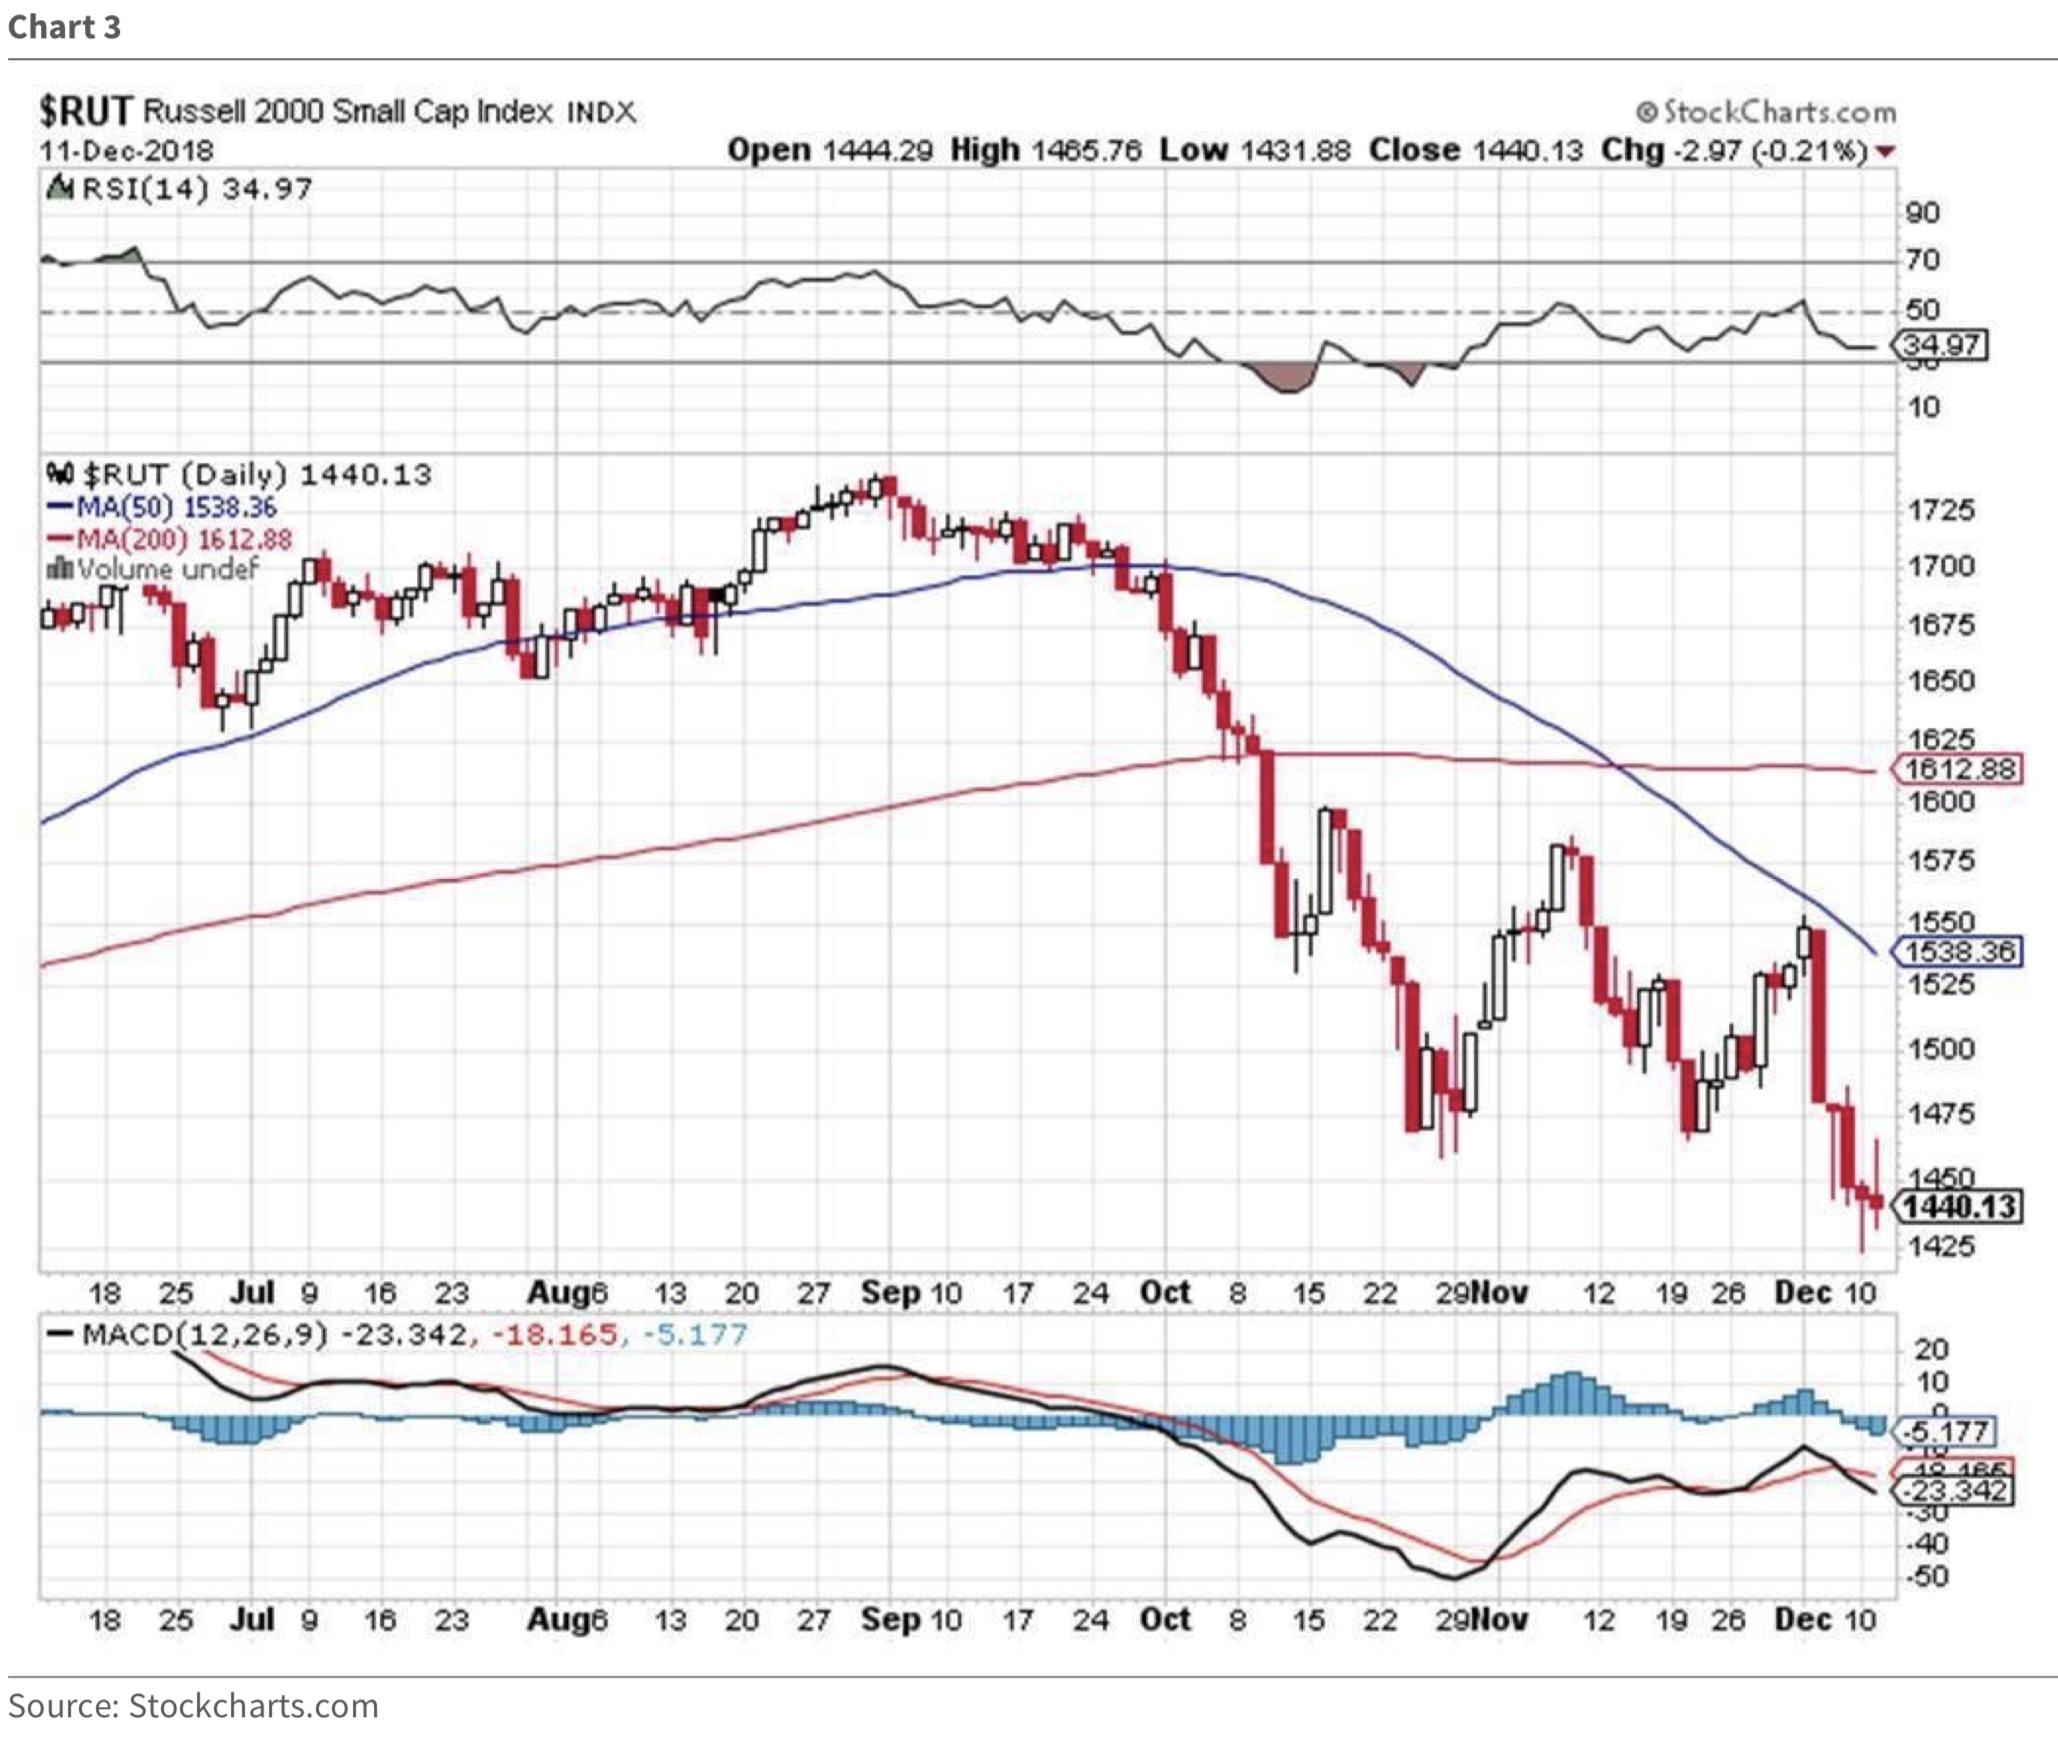
Russell 2000
Likewise, the Russell 2000 is some 10% below its 200-day moving average and, therefore, oversold (see chart below).
Russell 2000 10% Below It’s 200-Day Moving Average
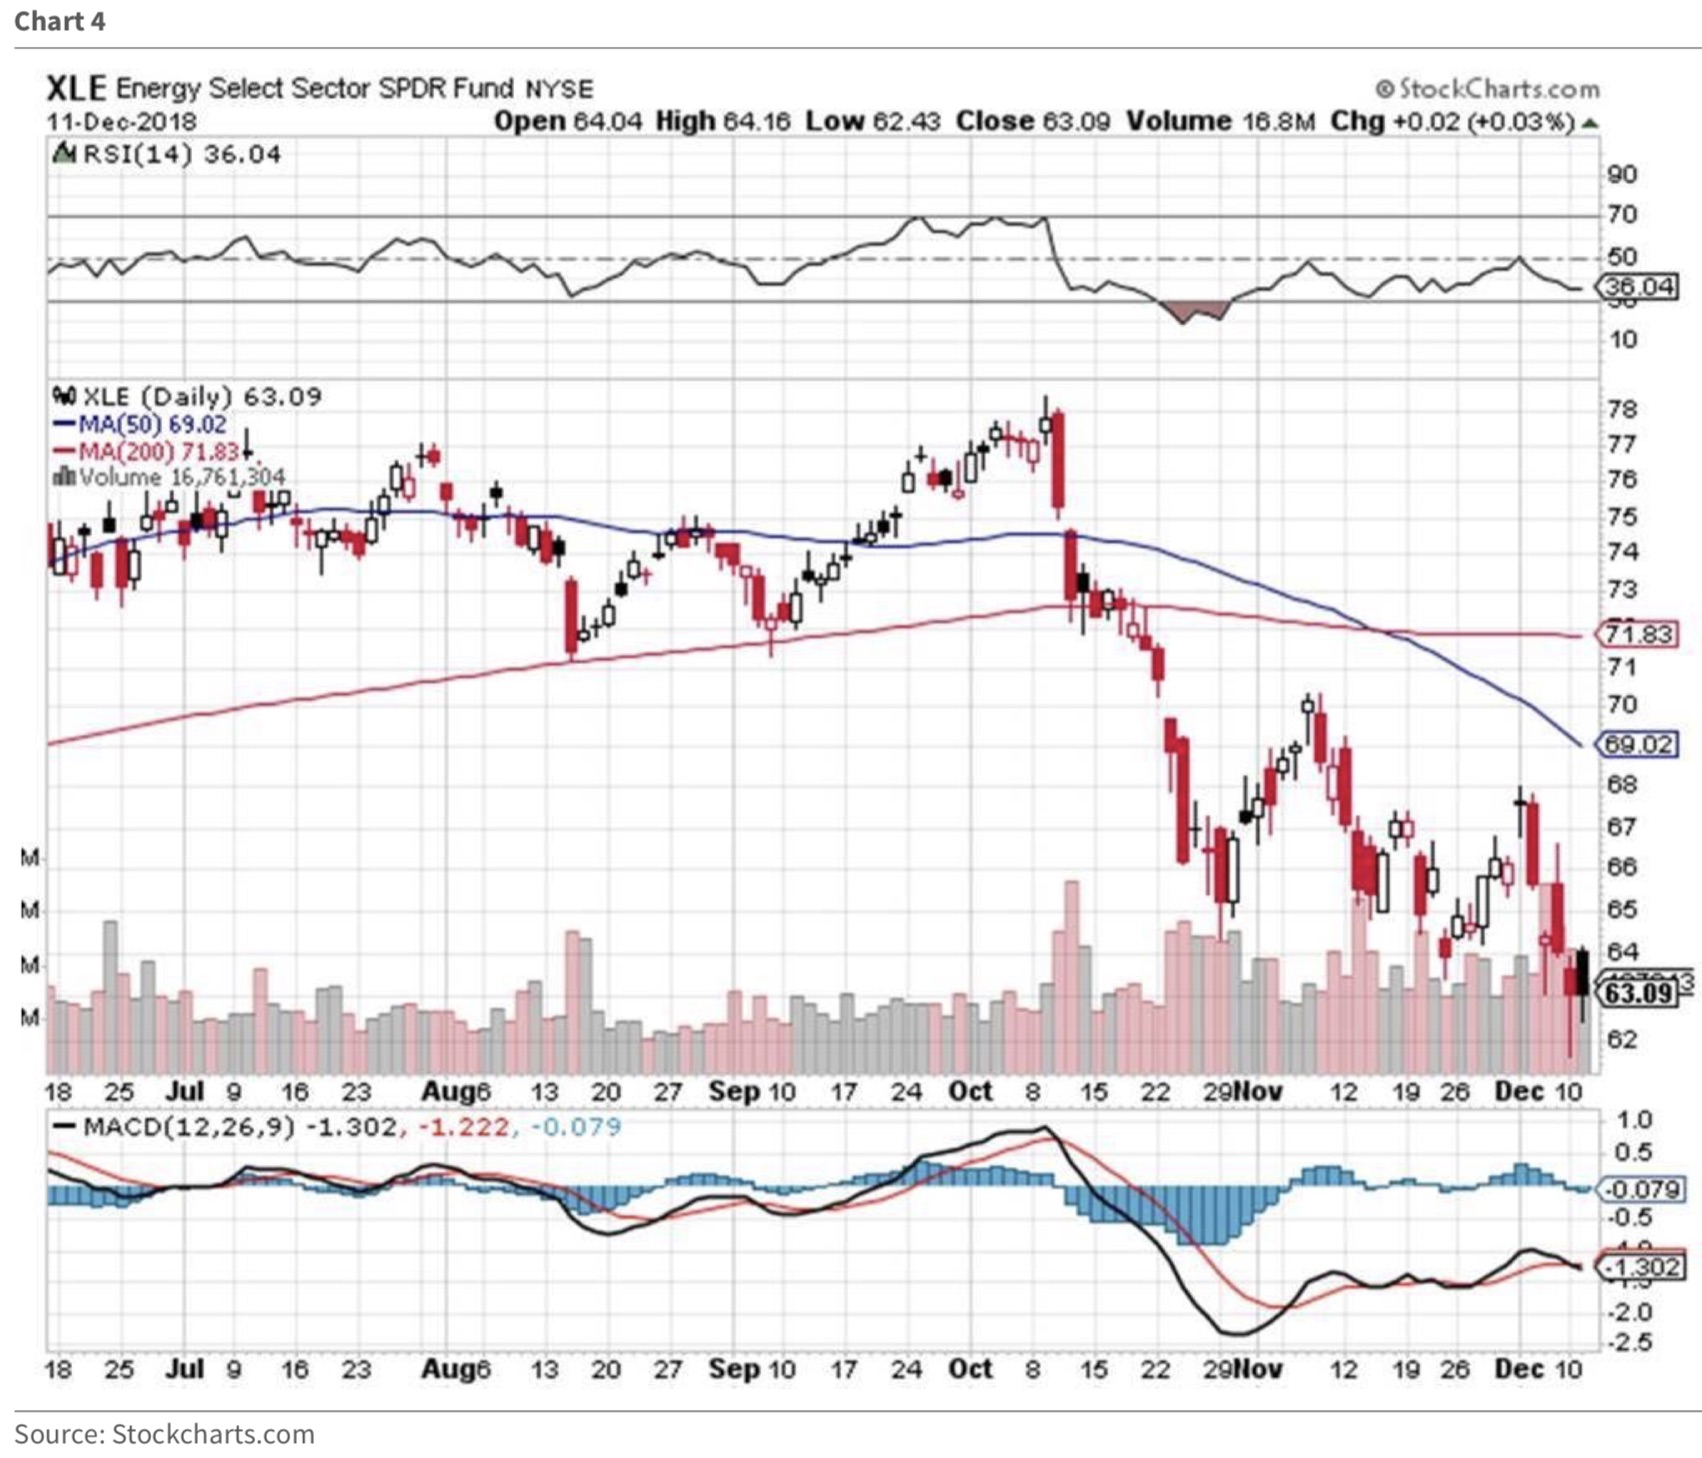
Energy Complex
And, don’t look now, but the energy complex is very oversold (also has a hammer chart formation – see chart below) with the anecdotal evidence that a bottom is near with three large energy-centric hedge funds closing their doors.
Energy Complex Also Very Oversold
About A Dow Theory “Sell Signal”
As for the questions about a Dow Theory “sell signal” that are being trumpeted by some on the Street of Dreams, by our method of interpreting Dow Theory, there has been no “sell signal.”
The problem is these folks are using the November closing low for the Industrials, which is the wrong reaction closing low to use. While it is true the D-J Transports notched a new reaction low last Friday, the D-J Industrials have not violated their March 2018 closing low (the right closing low to use).
As such, what we have, according to Dow Theory by our method of interpretation, is a downside non-confirmation, which should be interpreted bullishly…
- Source, King World News